Attenuation table
The traces in each capsule's isolation graph show how effectively the headphone isolates the wearer from external sound across the audible frequency range in third-octave steps, but it does not provide a straightforward indication of by how much common types of environmental noise are suppressed. This information – which may be crucial if you are looking for a headphone to provide effective isolation in particular circumstances – is provided by the pop-up attenuation table which appears when you place the mouse cursor over the blue text symbol near the bottom-right corner of the graph (or tap on it if using a touchscreen). An example attenuation table is shown below, this for the right capsule of the PSB M4U 8, which has three modes of operation including active noise cancellation. Passive headphones have just one column of attenuation figures. A negative value indicates attenuation; −10dB corresponds approximately to a halving of the perceived sound strength (loudness).

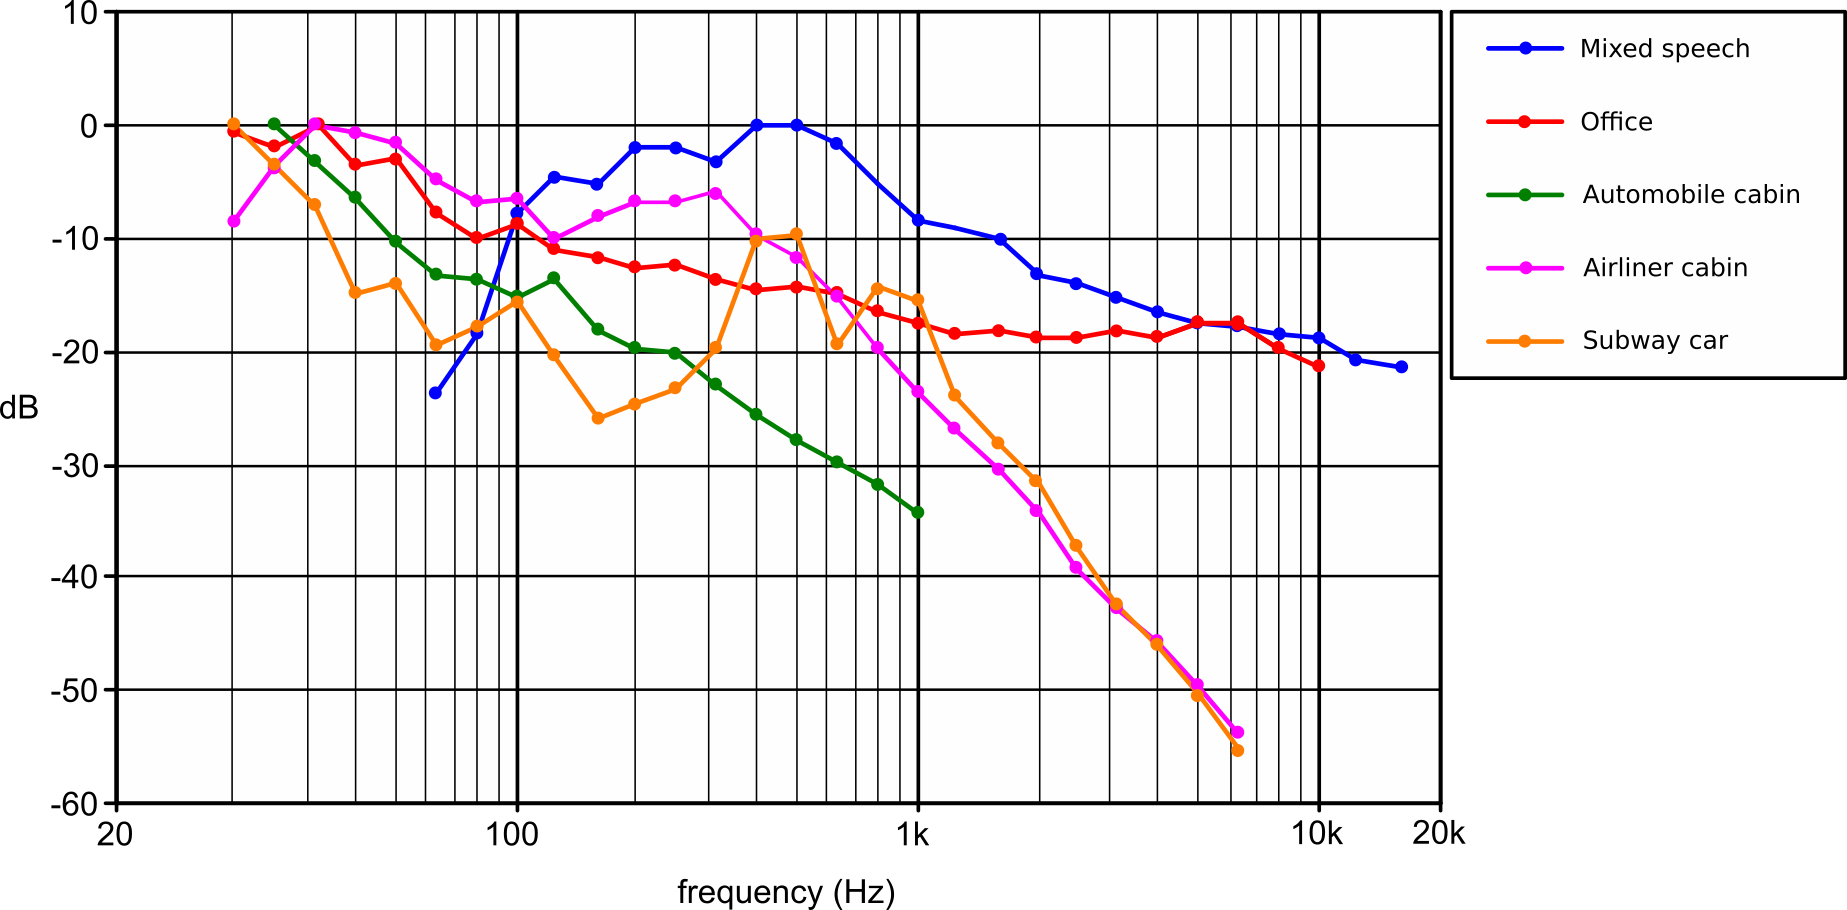
The attenuation values in the graph are all in units of dB(A) Leq, ie. they are subject to A-weighting (as defined in IEC standard 61672:2003) so as to approximate the perceived reduction in loudness that wearing the headphone provides. Attenuation values are quoted for six different types of environmental noise: white-spectrum noise, mixed speech, office noise, automobile cabin noise, jet airliner cabin noise and subway train interior noise. Except for the white noise attenuation, they are calculated by applying A-weighting to the average spectrum of example recordings of the noise type and then determining the attenuation of the weighted spectrum provided by the isolation of the headphone. As shown in the graph below, each noise type has a distinctive spectrum and is therefore subject to different attenuation by the headphone (white noise has a flat response).
The noise spectra, all normalised to a peak value of 0dB, were obtained from the following sources:
Mixed speech
This spectrum was measured from a purpose-assembled WAV file combining portions of the female speech and male speech items from the EBU SQAM (Sound Quality Assessment Material) test CD, tracks 49 and 50 (available
here and worth a listen if only to smile at the accents). This spectrum is distinct from the others in peaking at midrange frequencies and having a declining trend below 125Hz.
Office
This spectrum is the average of the Office M, Office T, and Office V spectra (obtained during office hours) published in the paper S K Tang and J W C Chan, "Some Characteristics of Noise in Air-Conditioned Landscaped Offices", Applied Acoustics, volume 48 number 3, pages 249 to 267, 1996 (available
here). As the spectra are only presented graphically, not in tabular form, the data was extracted using what in technical drawing is deprecated as 'scaling', ie. using a ruler. Although it peaks at LF, the spectrum is flatter than the other five.
Automobile cabin
This spectrum is an average of the spectra published in the paper A Farina and E Uoglotti, "Subjective evaluation of the sound quality in cars by the auralisation technique" (available
here), which were measured in the cabins of six different models of European passenger car (Audi 80, Audi 100, Fiat Chroma, Fiat Dedra, Fiat Punto and Fiat Tempra) travelling at 90kph (56mph). As the spectra are only presented graphically in the paper, this data too was extracted by scaling. Spectral content is dominated by low frequencies, and declines rapidly with rising frequency.
Airliner cabin
This spectrum was measured from a recording of Boeing 727 cabin noise available
here, at this entry in the listing:
It was chosen in preference to numerous other recordings of aircraft cabin noise available online because many of these appear to have been made using smartphones having curtailed low frequency response. Note that, despite aircraft cabin noise commonly and carelessly being referred to as 'white noise' by those who have no grasp of the terminology, it most certainly is not – as the spectrum clearly shows.
Subway car
This spectrum was taken from a WAV file recorded by KH (using a Behringer ECM8000 measurement microphone, Focusrite Scarlett Solo USB audio interface, and an Android tablet running Audio Evolution Mobile v4.9.5 recording software) on a notoriously noisy section towards the southern end of the Victoria Line, northbound between Stockwell and Vauxhall stations, on London's Underground. The noise here is not just rumbly but sometimes screechy too, hence the broad peaks in the spectrum around 450Hz and 900Hz. You can download the zipped WAV file
here.